The problem
Bends in ductwork waste energy, but how much, and why?
Internal flow · ME 347 · Cal Poly
Every bend in a duct costs energy. With a team of four, I measured pressure at 30 points around a bend, compared it with two textbook models, and quantified exactly how much the turn costs.
The problem
Bends in ductwork waste energy, but how much, and why?
What I did
Read 30 pressure taps with a manometer and compared the results to one- and two-dimensional flow models.
The result
The bend lost about 3× the pressure of an equivalent straight duct (78.33 vs. 25.75 Pa), a loss coefficient of K = 0.112.
Recorded pressure along the inner wall, outer wall, and across the bend.
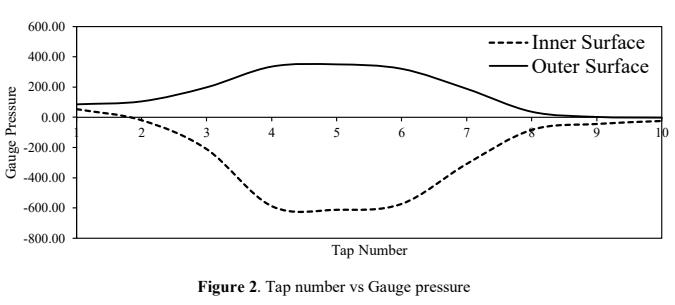
Showed how the turn pushes pressure up outside and down inside.
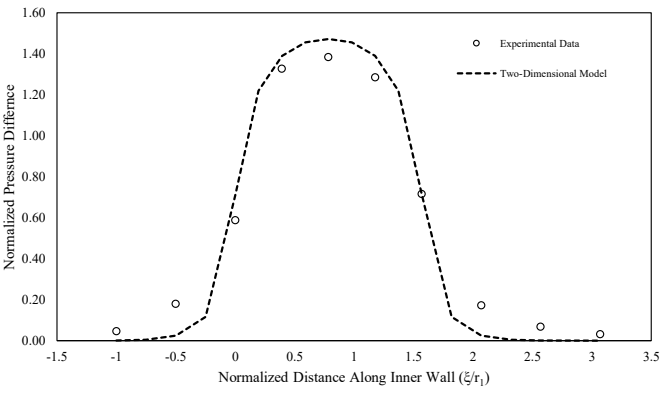
Checked the data against two ideal-flow models.
Calculated the extra energy loss caused by the bend.
Worked with a team of four on this lab, and I measured how a 90-degree turn redistributes pressure across a rectangular duct. We compared the experiment with one- and two-dimensional ideal-flow models and quantified the additional loss caused by the bend.
Thirty pressure taps across one curved flow path
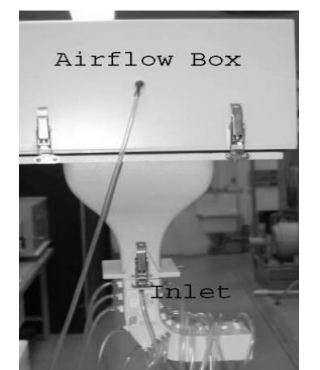
An airflow box supplied steady flow through a contraction and into the rectangular bend. An inclined water manometer recorded differential pressure at ten inner-wall taps, ten outer-wall taps, and ten taps across the bend radius.
Ambient pressure and temperature established air density. The airbox-to-inlet pressure difference gave an average duct velocity of 34.16 m/s. A separate estimate from the inner-to-outer pressure difference and the free-vortex model gave 32.17 m/s.
Curvature creates the pressure gradient that turns the flow
Pressure separated sharply between the two walls near the middle of the bend. At tap 5, the inner wall reached -611.90 Pa while the outer wall reached 350.01 Pa. The profiles returned toward similar values near the outlet.
The higher pressure at the outer wall supplies the radial pressure gradient required for centripetal acceleration. The inner and outer curves therefore form opposite peaks around the center of the turn.
| Tap | Inner wall | Outer wall | Pressure separation |
|---|---|---|---|
| 1 | 53.85 Pa | 85.67 Pa | 31.82 Pa |
| 3 | -210.49 Pa | 198.26 Pa | 408.75 Pa |
| 5 | -611.90 Pa | 350.01 Pa | 961.91 Pa |
| 7 | -308.40 Pa | 188.46 Pa | 496.86 Pa |
| 10 | -24.48 Pa | -2.45 Pa | 22.03 Pa |
The two-dimensional model captured the shape
The normalized inner-wall pressure difference rose through the bend, peaked near its midpoint, and fell toward the outlet. The experiment followed the two-dimensional inviscid model closely in shape.
The measured values deviated where the ideal model could not represent viscosity, wall shear, losses, secondary flow, or local separation.
Pressure increased from the inner radius to the outer radius
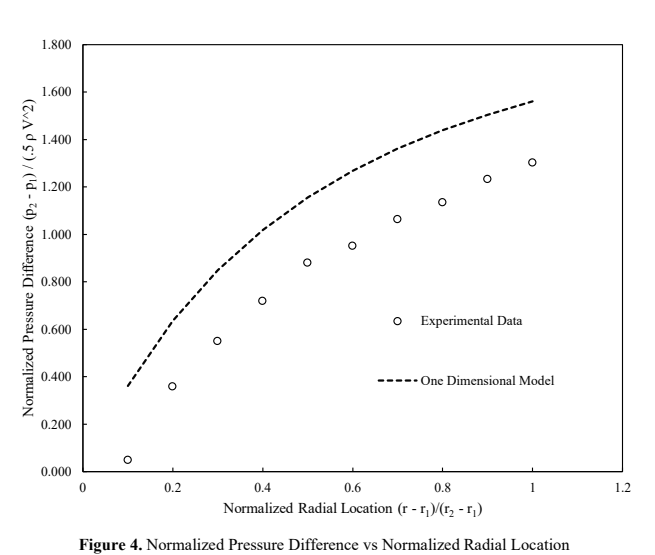
The radial taps showed a monotonic pressure increase toward the outer wall. That trend matched the free-vortex model and the expected balance between pressure force and centripetal acceleration.
The one-dimensional model consistently overpredicted the normalized pressure difference. The idealized model captured the direction and curvature of the result but omitted the losses and three-dimensional flow structures present in the apparatus.
Turning the flow cost more pressure than wall friction alone
The measured bend-loss coefficient was K = 0.112, corresponding to a 78.33 Pa pressure drop. The lab-manual chart gave K ≈ 0.12 and 83.41 Pa, a close independent check.
An equivalent length of straight commercial-steel duct produced an estimated 25.75 Pa drop. The bend loss was about three times larger because the turn introduced secondary flow, greater turbulence, and possible separation in addition to ordinary wall friction.