The problem
Drag is hard to measure directly, so engineers infer it from pressure. But which measurement can you trust?
Wind tunnel testing · ME 347 · Cal Poly
In Cal Poly’s wind tunnel, my team of four measured air pressure around a cylinder and the wake behind it. One method matched published data and the other didn’t. Figuring out why was the real lesson.
The problem
Drag is hard to measure directly, so engineers infer it from pressure. But which measurement can you trust?
What I did
Recorded surface pressure every 10° around the cylinder and surveyed the wake at two distances behind it.
The result
The pressure data matched known behavior. I traced the wake mismatch to specific measurement error sources.
Mounted a brass cylinder across the flow and located its stagnation point.
Recorded pressure every 10° from front to back.
Traversed a probe through the wake at two downstream distances.
Computed drag both ways and explained why they disagreed.
Worked with a team of four on this lab, and I measured how air moves around a brass cylinder and compared two independent drag estimates. The pressure result matched published behavior; the wake result did not, making measurement quality as important as the final number.
One cylinder, two ways to measure drag
A 1.50 in brass cylinder was mounted perpendicular to the flow in the Cal Poly mechanical engineering wind tunnel. After locating the stagnation point, the team recorded surface pressure in 10-degree increments from 0 to 180 degrees.
A Pitot-static probe on an x-y traverse then sampled the wake at 17.5 in and 25.0 in downstream. Ambient conditions and free-stream dynamic pressure established air density, velocity, and a cylinder Reynolds number of 3.49 × 10⁴.
The expected signature of separation
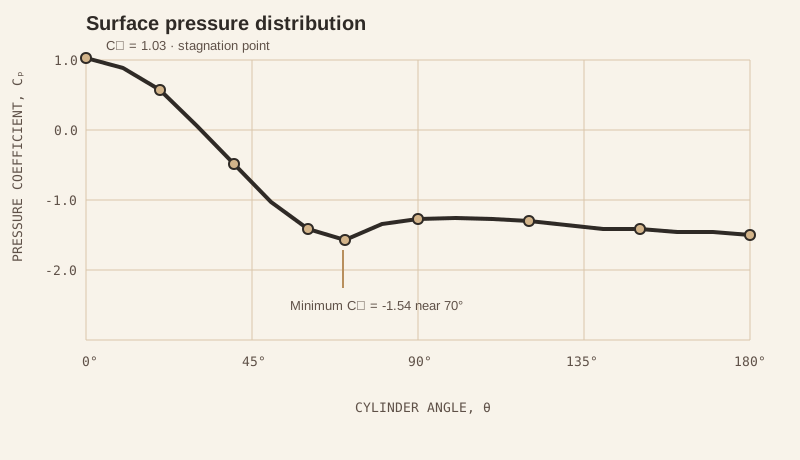
The stagnation point produced the largest pressure coefficient, Cp = 1.03. Pressure fell as the flow accelerated around the cylinder, reached Cp = -1.54 near 70 degrees, and remained negative across the rear surface—a broad low-pressure region consistent with separated flow.
Velocity deficit and downstream recovery
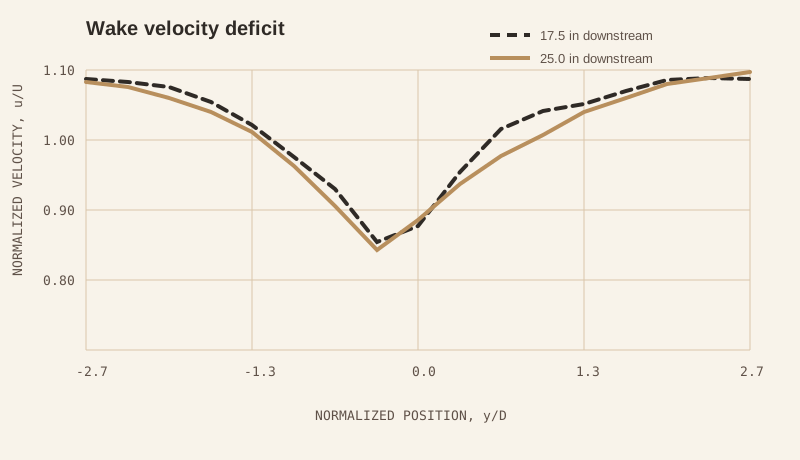
Both wake surveys showed their lowest normalized velocity near the cylinder centerline and recovery toward free-stream velocity away from the wake. The profile farther downstream appeared broader and smoother, which is consistent with turbulent mixing.
A good result and a useful discrepancy
Numerically integrating the surface pressure distribution gave CD = 1.256, close to the expected value of approximately 1.2. Integrating the wake momentum deficit produced much lower values, so those results were treated as evidence of an incomplete or inconsistent wake survey—not as validated drag coefficients.
| Method | Location / source | Drag coefficient, CD | Assessment |
|---|---|---|---|
| Surface pressure | Cylinder surface | 1.256 | Agrees with reference |
| Wake momentum | x = 17.5 in | 0.179 | Underestimated |
| Wake momentum | x = 25.0 in | 0.031 | Underestimated |
| Reference behavior | ReD = 3.49 × 10⁴ | ≈ 1.2 | Expected range |
Validate the method, not only the arithmetic
The experiment connected surface pressure, separation, wake formation, and pressure drag in one test. More importantly, comparing independent methods exposed a measurement problem that a single calculation would have hidden.
A stronger repeat test would re-zero the transducer before each traverse, verify probe alignment, extend the survey beyond the full velocity deficit, and repeat multiple passes to quantify the unsteadiness of the wake.